6.10 EMP_WGCNA_cor_analysis
After the WGCNA clustering analysis, the module EMP_WGCNA_cor_analysis used the PCA method to reduce the dimensionality of the clustering module, and the axis with the most explanatory degree was associated with the target data, to explore which clustering data have potential follow-up analysis value.
6.10.1 WGCNA analysis within single omics data
🏷️Example 1:
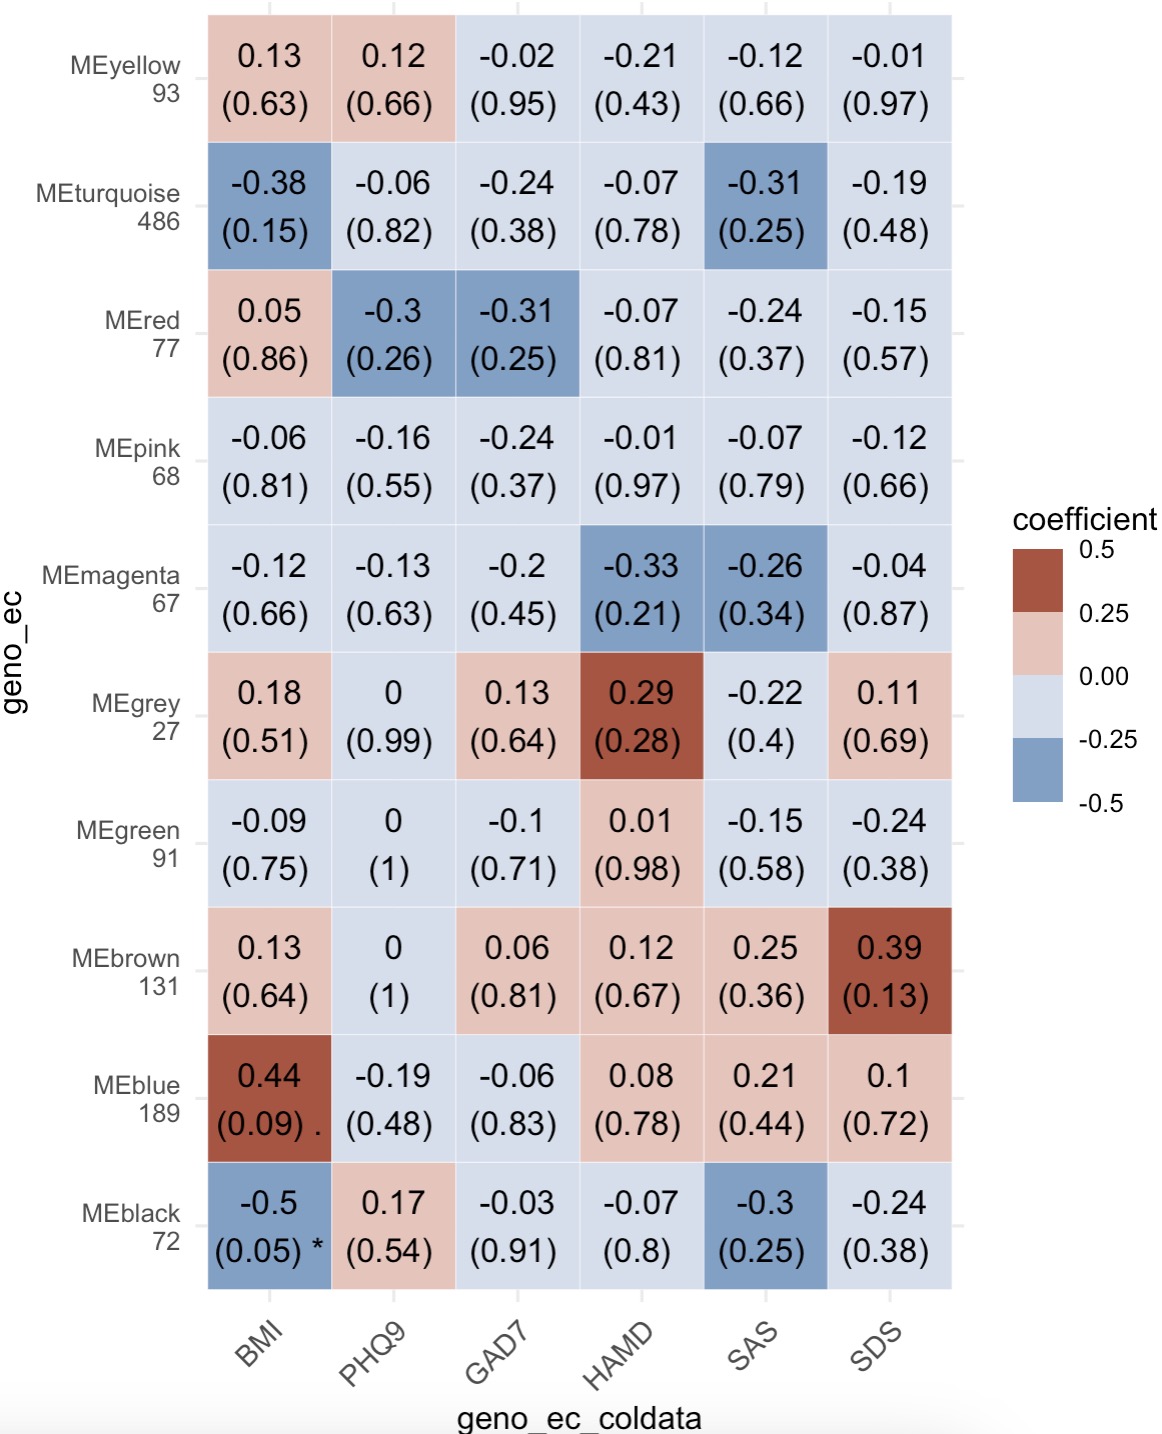
The assay from experiment geno_ec was extracted from the MAE object firstly. Then the core genes were screened by the edgeR method, and subsequently the cluster analysis was performed by WGCNA and the correlation analysis of the sample related data. Finally, the results were visualized by drawing heatmap.
MAE |>
  EMP_assay_extract('geno_ec')  |>
  EMP_identify_assay(method = 'edgeR',estimate_group = 'Group') |>
  EMP_WGCNA_cluster_analysis(RsquaredCut = 0.85,mergeCutHeight=0.4)  |>
  EMP_WGCNA_cor_analysis(coldata_to_assay = c('BMI','PHQ9','GAD7','HAMD','SAS','SDS')) |>
  EMP_heatmap_plot()
🏷️Example 2:
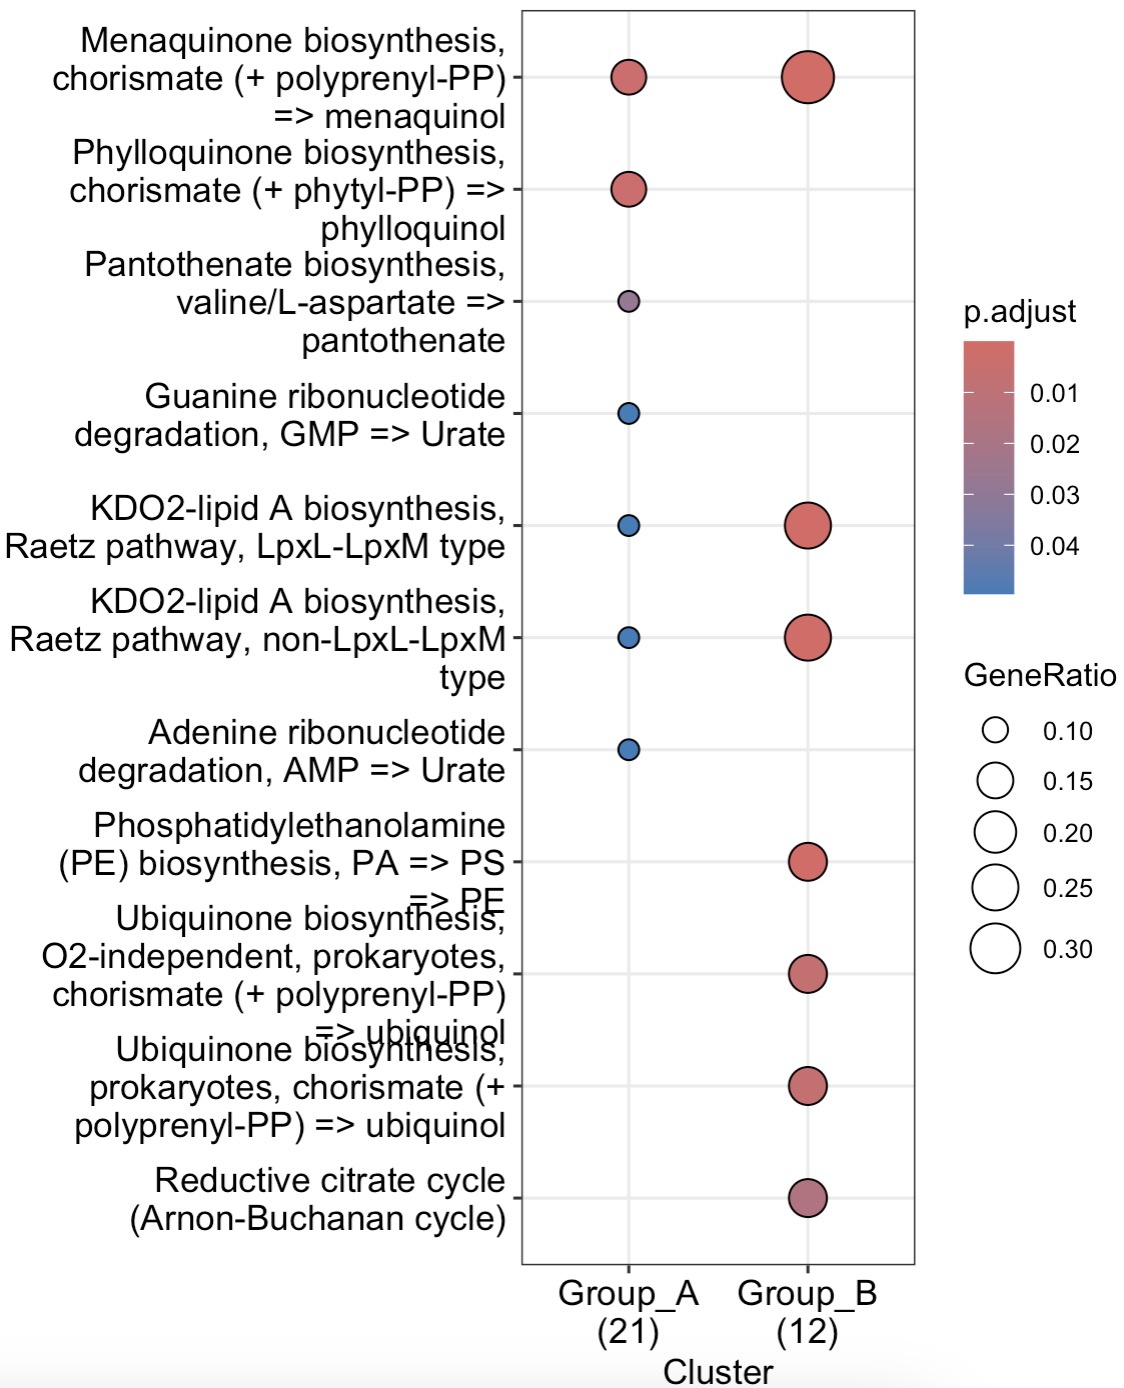
After WGCNA cluster analysis and correlation analysis, the module with a statistically significant correlation with the relevant data of the target sample can be selected for downstream differentiation and enrichment analysis.
MAE |>
  EMP_assay_extract('geno_ec')  |>
  EMP_identify_assay(method = 'edgeR',estimate_group = 'Group') |>
  EMP_WGCNA_cluster_analysis(RsquaredCut = 0.85,mergeCutHeight=0.4)  |>
  EMP_WGCNA_cor_analysis(coldata_to_assay = c('BMI','PHQ9','GAD7','HAMD','SAS','SDS')) |>
  EMP_filter(feature_condition = WGCNA_color=='black') |>
  EMP_diff_analysis(method = 'DESeq2',.formula = ~Group) |>
  EMP_enrich_analysis(keyType = 'ec',KEGG_Type = 'MKEGG') |>
  EMP_enrich_dotplot()
6.10.2 WGCNA analysis within multi-omics data
🏷️Example:
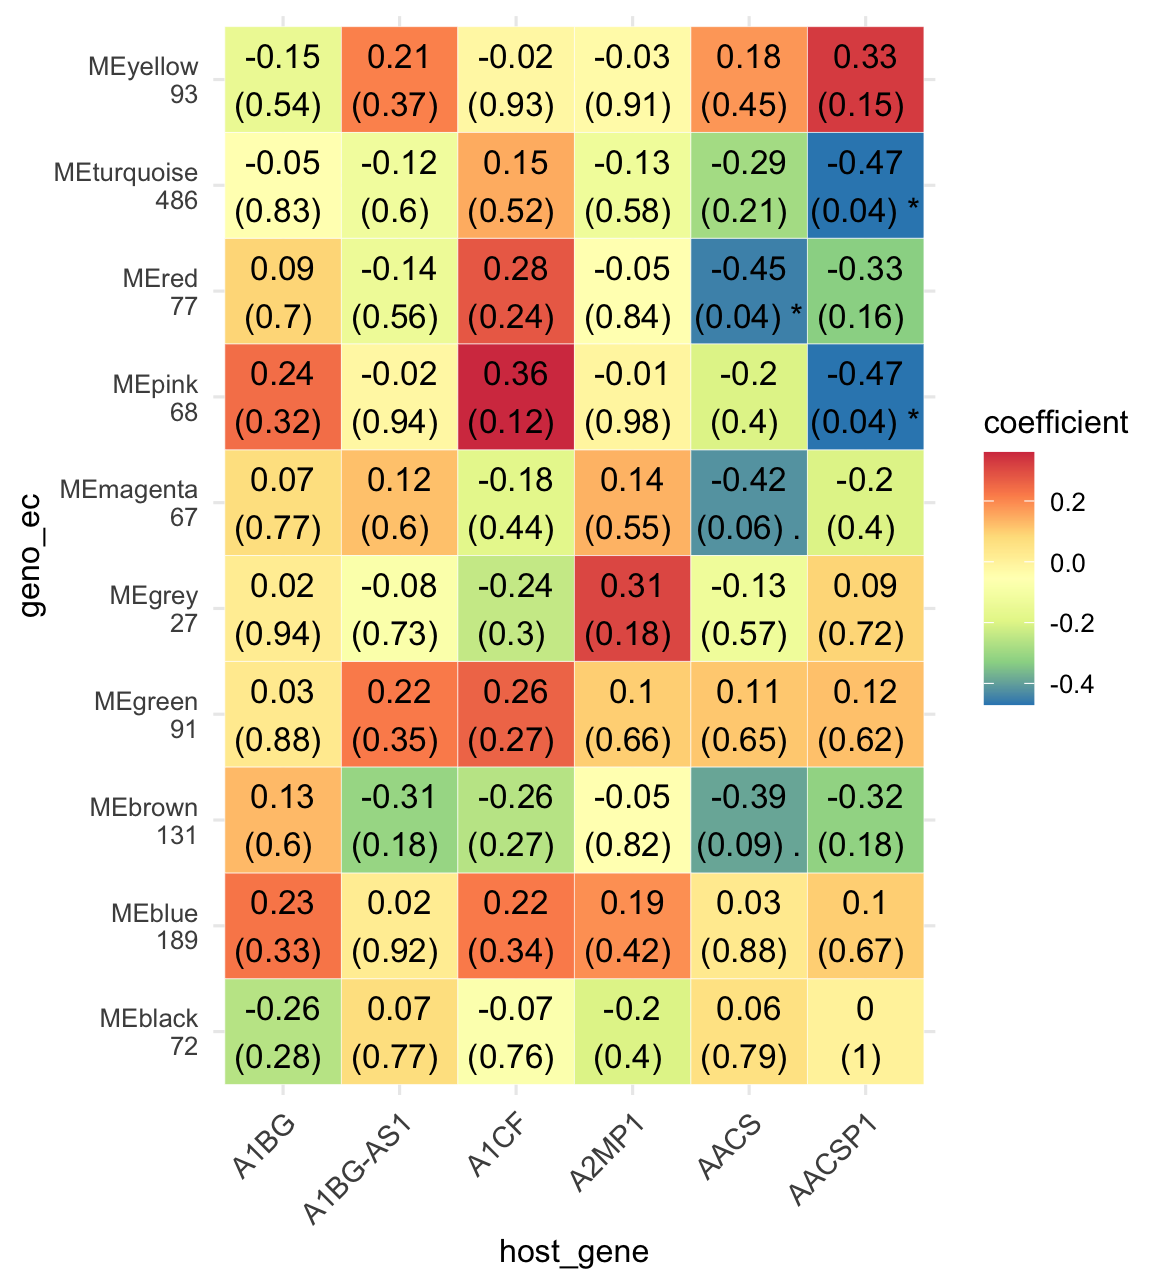
Firstly, the assays from experiment geno_ec were extracted from the MAE object. Then, the core genes screened by the edgeR method were clustered subsequently. Secondly, the genes of interest in the experiment host_gene were extracted from the MAE object (or the target gene was selected using methods such as difference analysis). The two omics were connected using the + sign and WGCNA correlation analysis was performed.
In this process, the WGCNA clustering result is extracted from the first omics for WGCNA correlation analysis with the second omics by default, so pay attention to the order of using
+ merging omics.
k1 <- MAE |>
  EMP_assay_extract('geno_ec')  |>
  EMP_identify_assay(method = 'edgeR',estimate_group = 'Group') |>
  EMP_WGCNA_cluster_analysis(RsquaredCut = 0.85,mergeCutHeight=0.4)

k2 <- MAE |>
  EMP_assay_extract('host_gene',pattern = c('A1BG','A1CF','A2MP1','AACS'),
                    pattern_ref = 'feature')

(k1 + k2) |>
  EMP_WGCNA_cor_analysis() |>
  EMP_heatmap_plot(palette = 'Spectral')